Melbourne has some of the world’s best drinking water. We regularly test it at multiple points throughout our water supply network, to verify it meets strict quality standards.
Did you know?
Your water’s colour, taste and smell can change throughout the year. This is very normal, and usually depends on factors like:
- which reservoir your water is from – each naturally varies in colour and mineral content
- demand – more water is used in summer, so it travels faster through the pipes
- water temperature – cooler water generally tastes better.
Drinking water quality standards
No matter where it comes from, all the water we supply must meet strict water quality requirements. We are regularly audited under the Safe Drinking Water Act 2003, and report drinking water quality results and issues to the Department of Health.
The laws and guidelines we follow include:
- Safe Drinking Water Act 2003 and Safe Drinking Water Regulations 2015 (Department of Health)
- Australian Drinking Water Guidelines 2011 (National Health and Medical Research Council)
- our bulk water supply agreements with Melbourne’s retail water companies, which include water quality standards.
Water quality testing verifies we meet these requirements. It also helps us fine-tune our water treatment processes, identify potential issues like algal blooms, and inform decisions on where to transfer water – for example, avoiding reservoirs experiencing water quality issues.
Water sampling and testing
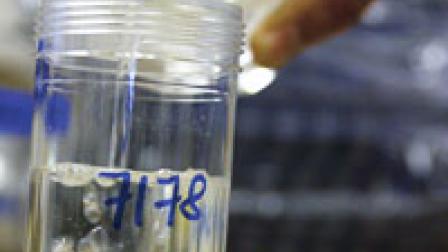
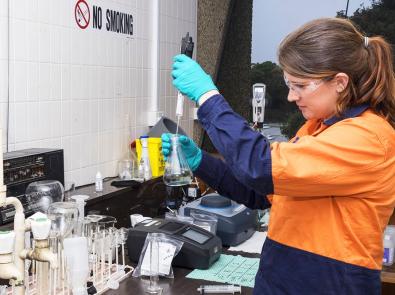
We test water samples from over 160 sites within our water supply network each year – including our storage and service reservoirs, aqueducts and transfer mains. We also test water at points of supply to the retail water companies, as a final check that it meets requirements before being transferred into the network that supplies homes and businesses.
We test for a number of parameters, including:
- clarity (turbidity)
- minerals and natural substances like iron and manganese
- colour
- pH
- bacteria, such as E. coli
- chlorine and fluoride levels
- contaminants like fuel, pesticides* and Per and polyfluoroalkyl substances (PFAS).
*Our monitoring indicates levels of pesticides in Melbourne’s water are well below the current health based guideline values.
Water quality data
The following data represents a typical analysis of Melbourne’s drinking water quality over a year. This is based on testing results at our major storage reservoirs, once water has been through the primary treatment process.
Tip: to fully view data tables on smartphones and tablets, place your finger on the table and scroll left or right.
Last updated: October 2024
- Basic parameters
-
Parameter Cardinia Greenvale Silvan Sugarloaf Tarago Upper Yarra Chlorine - free (mg/L)
0.52–1.70
0.64–1.40 0.80–1.80 0.58–1.20 0.18–1.20 0.11–1.30 Chlorine - total (mg/L) 0.57–1.90 0.78–1.50 0.98–2.00 0.70–1.50 0.22–1.40 0.23–1.70 Colour (Pt/Co) 2.00–6.00 2.00–8.00 2.00–10.00 2.00–6.00 2.00–4.00 2.00–10.00 E. coli (orgs/100mL) 0.00–0.00 0.00–0.00 0.00–0.00 0.00–0.00 0.00–0.00 0.00–0.00 Electrical conductivity (uS/cm) 51.00–110.00 56.00–84.00 40.00–80.00 79.00–150.00 110.00–190.00 45.00–82.00 Fluoride (mg/L) 0.23–0.94 0.73–0.86 0.05–0.90 0.05–0.98 0.69–0.91 pH - field (pH units) 6.80–7.90 6.90–7.70 6.80–7.80 6.70–7.50 6.70–7.50 6.60–7.50
Total organic carbon (mg/L) 1.00–6.00 1.20–7.70 1.20–55.00 0.60–2.00 1.60–9.10
1.10–11.00 Turbidity - lab (NTU) 0.20–0.60 0.60–1.80 0.40–1.60 0.10–0.40 0.10–0.20 0.40–1.90 - Metals
-
Parameter Cardinia Greenvale Silvan Sugarloaf Tarago Upper Yarra Aluminium (mg/L) 0.0020–0.0300
0.0600–0.1500 0.0400–0.0800 0.0100–0.0400 0.0100–0.0500 0.0300–0.0900 Aluminium - acid soluble (mg/L) 0.0050–0.0140 0.0120–0.0300
0.0220–0.0320
0.0120–0.0430 0.0100–0.0500 0.0120–0.0200 Arsenic (mg/L) 0.0010–0.0010
0.0010–0.0010 0.0010–0.0010 0.0010–0.0010 0.0010–0.0010 0.0010–0.0010 Boron - soluble (mg/L) 0.1000–0.1900
0.0200–0.0500 0.0200–0.0800 0.0200–0.0500 0.0500–0.0500 0.0500–0.0500 Bromide (mg/L) 0.0100–0.0500
0.0100–0.0500 0.0100–0.0500 0.0100–0.0100 Cadmium (mg/L) 0.0002–0.0002 0.0002–0.0002 0.0002–0.0002 0.0002–0.0002 0.0002–0.0002 0.0002–0.0002 Chromium (mg/L) 0.0010–0.0010 0.0010–0.0010 0.0010–0.0010 0.0010–0.0010 0.0010–0.0010 0.0010–0.0010 Copper (mg/L) 0.0120–0.0900
0.0060–0.0250 0.0860–0.1600 0.0010–0.0010 0.0010–0.0010 0.0010–0.0020 Iron (mg/L) 0.0200–0.0900
0.0500–0.1400 0.0400–0.0900 0.0100–0.0300 0.0100–0.0200 0.0600–0.1000 Lead - total (mg/L) 0.0010–0.0010
0.0010–0.0010 0.0010–0.0010 0.0010–0.0010 0.0010–0.0010 0.0010–0.0010 Manganese (mg/L) 0.0010–0.0220
0.0010–0.0100 0.0020–0.0090 0.0020–0.0500 0.0010–0.0550
0.0020–0.0110 Manganese - soluble (mg/L) 0.0010–0.0030
0.0010–0.0010 0.0010–0.0040 0.0010–0.0050
0.0010–0.0050
Nickel (mg/L) 0.0010–0.0010
0.0010–0.0010
0.0010–0.0010
0.0010–0.0010
0.0010–0.0010
0.0010–0.0010
Zinc (mg/L)
0.0010–0.0060
0.0030–0.0120
0.0050–0.0080
0.0010–0.0020 0.0010–0.0020 0.0010–0.0010 - Salinity indicators
-
Parameter Cardinia Greenvale Silvan Sugarloaf Tarago Upper Yarra Alkalinity (mg/L)
13.00–21.00 11.00–13.00 7.00–13.00 8.00–12.00 22.00–27.00 10.00–17.00 Calcium (mg/L)
5.10–8.10 2.60–5.10 1.70–7.20 4.40–7.60 7.50–11.00 1.50–2.30 Chloride (mg/L)
7.00–8.00 9.00–10.00 7.00–8.00 15.00–17.00 21.00–31.00 6.00–7.00 Hardness (mg/L)
16.00–25.00 11.00–21.00 10.00–27.00 16.00–28.00 27.00–38.00 9.00–14.00 Magnesium (mg/L)
0.90–1.20 1.00–2.00 1.10–2.20 1.30–2.10 1.90–2.70 1.20–1.90 Potassium (mg/L)
0.40–0.60 0.50–0.80 0.50–0.90 0.80–1.30 1.60–2.10 0.50–0.80 Sodium (mg/L)
4.40–5.20 4.50–6.90 3.50–5.80 6.70–10.00 10.00–13.00 4.20–6.00 Sulphate/sulfate (mg/L)
1.00–1.00 1.00–4.00 1.00–2.00 11.00–19.00 2.00–2.00 1.00–2.00 - Disinfection byproducts
-
Parameter Cardinia Greenvale Silvan Sugarloaf Tarago Upper Yarra Bromodichloromethane (ug/L)
8.000–12.000 6.000–7.000 1.000–7.000 1.000–12.000 1.000–25.000 1.000–7.000 Bromoform (mg/L)
0.001–0.001 0.001–0.001 0.001–0.001 0.001–0.001 0.001–0.001 0.001–0.001 Chlorate (mg/L)
0.010–0.010 0.050–0.110 0.010–0.050 0.040–0.100 0.030–0.060 Chloroform (mg/L)
0.011–0.014 0.007–0.014 0.016–0.028 0.005–0.006 0.013–0.020 0.002–0.004 Dibromochloromethane (mg/L)
0.001–0.001 0.001–0.001 0.001–0.001 0.003–0.005 0.004–0.006 0.001–0.001 Dichloroacetic acid (mg/L)
0.005–0.014 0.005–0.005 0.007–0.025 0.005–0.005 0.005–0.013 0.005–0.010 Monochloroacetic acid (mg/L)
0.005–0.005 0.005–0.005 0.005–0.005 0.005–0.005 0.005–0.005 0.005–0.005 Trichloroacetic acid (mg/L)
0.005–0.015 0.005–0.005 0.006–0.021 0.005–0.005 0.005–0.012 0.005–0.008 Trihalomethanes (mg/L)
0.017–0.020
0.010–0.020
0.018–0.033
0.013–0.017
0.026–0.041
0.002–0.004
- Nutrients
-
Parameter Cardinia Greenvale Silvan Sugarloaf Tarago Upper Yarra Ammonia (mg/L)
0.003–0.013 0.007–0.020 0.002–0.011 0.002–0.009 0.002–0.016 0.004–0.008 Nitrate (mg/L)
0.074–0.096 0.120–0.200 0.170–0.270 0.270–0.370 0.270–0.500 0.160–0.280 Nitrite (mg/L)
0.002–0.004 0.002–0.002 0.002–0.002 0.002–0.003 0.002–0.003 0.002–0.002 Nitrogen (TKN) (mg/L)
0.100–0.140 0.090–0.160 0.070–0.140 0.090–0.250 0.160–0.390 0.080–0.130 Nitrogen - total (mg/L)
0.200–0.210 0.220–0.290 0.240–0.370 0.390–0.570 0.520–0.750 0.280–0.390 Phosphate (mg/L as P)
0.003–0.005
0.004–0.006
0.003–0.005
0.003–0.006
0.003–0.009
0.003–0.006
Phosphorus - total (mg/L)
0.005–0.008 0.006–0.010 0.005–0.010 0.005–0.024 0.009–0.027 0.005–0.007
You may also like...
Monitoring for PFAS in our Water Supply Catchments
Learn more about what we’re doing to ensure drinking water for our customers and communities is safe and is of the highest quality.
Water Quality Annual Report
An account of issues relating to water supply management and drinking water quality over the past financial year.

View Annual Water Quality reports, including an archive of those produced by City West Water and Western Water to 2020.
Search for the latest water quality results by suburb or a specific address within South East Water's service area.
View key water quality results by suburb or postcode within Yarra Valley Water's service area.


