Maroondah Reservoir is filled by rainfall received by the surrounding catchments. It transfers water to Sugarloaf Reservoir and onwards to Melbourne’s northern, western and inner suburbs.
When the reservoir overflows, water spills into the Yarra River. Some of this water can be pumped back out into Sugarloaf Reservoir.
Key facts
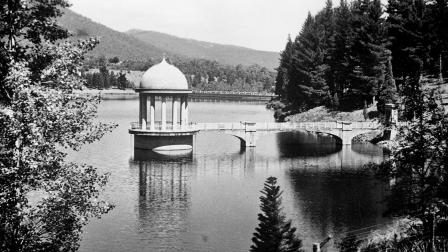
The dam at Maroondah Reservoir is a concrete gravity dam, and was completed in 1927.
Learn more about its history and explore 360-degree panaromas with the Maroondah water supply system virtual tour.

- Catchment area: 10,400 hectares
- Surface area: 200 hectares
- Total capacity: 22,179 megalitres
- Dam height: 41 metres
- Dam length: 291 metres
Water catchment protection and access
Maroondah Reservoir is an on-stream reservoir, filled by rivers or rainfall that runs off the nearby forested water catchments. There is:
- no entry into the protected water supply catchment, with offenders subject to prosecution under the Water Act 1989 (Vic)
- entry permitted to limited walking tracks and picnic areas (near Watts River) and the walking track along the open aqueduct.
Maroondah Highway runs through the catchment.
Melbourne Water continually reviews our protected catchments to determine if more areas can be opened to the public. While this would allow more people to enjoy Victoria’s vast natural spaces, it must be balanced with protecting our precious drinking water for the safety of our community.
Rainfall over the years
View highlights from our historical rainfall data for Maroondah Reservoir, including annual rainfall, monthly averages, and the wettest and driest years by month.
Live rainfall and water storage data
Get the latest information on each of our 10 major reservoirs, including daily water storage levels and hourly rainfall and river level data.
Annual rainfall at Maroondah (1893-2022)
")
Monthly rainfall records (mm)
Last updated: January 2023
| Month | Wettest | Driest | Average |
|---|---|---|---|
| January | 231.2 (1897) | 2.6 (1930) | 69.0 |
| February | 243.3 (1946) | 1.2 (2009) | 62.9 |
| March | 241.8 (1931) | 1.1 (1951) | 74.4 |
| April | 297.3 (1935) | 0.0 (1923) | 91.8 |
| May | 252.2 (1944) | 7.4 (1934) | 102.3 |
| June | 286.8 (1911) | 15.2 (1972) | 104.7 |
| July | 225.8 (1952) | 35.2 (2001) | 102.6 |
| August | 262.9 (1939) | 32.0 (1982) | 114.3 |
| September | 224.9 (1916) | 35.6 (1961) | 114.3 |
| October | 316.1 (1937) | 4.7 (1914) | 117.3 |
| November | 239.6 (2004) | 18.8 (1895) | 100.9 |
| December | 257.8 (1930) | 4.6 (1972) | 93.5 |
| Annual total | 1702.8 (1952) | 652.3 (1997) | 1148.2 |
You may also like...
Maroondah water supply system
Explore 360-degree views of the heritage-listed Maroondah system, which has supplied water to Melbourne since 1891.
Our water supply system
Melbourne has some of the highest-quality drinking water in the world. Learn how it makes its long journey to your tap.