Tips on using our interactive map to view rainfall, river level or river flow data at more than 200 sites.
Data available:
- rainfall
- river level
- river flow
Hourly rainfall data resets to 0mm at 9am, and is unavailable until 10am while it is being processed.
Using the app
Find a site
- browse the map — hover over a site to show its name
- enter a location into the search box
- use your current location — you’ll need to let your browser access this information
- choose a nearby site from the list
The icons show what types of data each site has, and if there are any issues affecting data availability. You can also apply filters so you only see sites with the data you’re interested in.
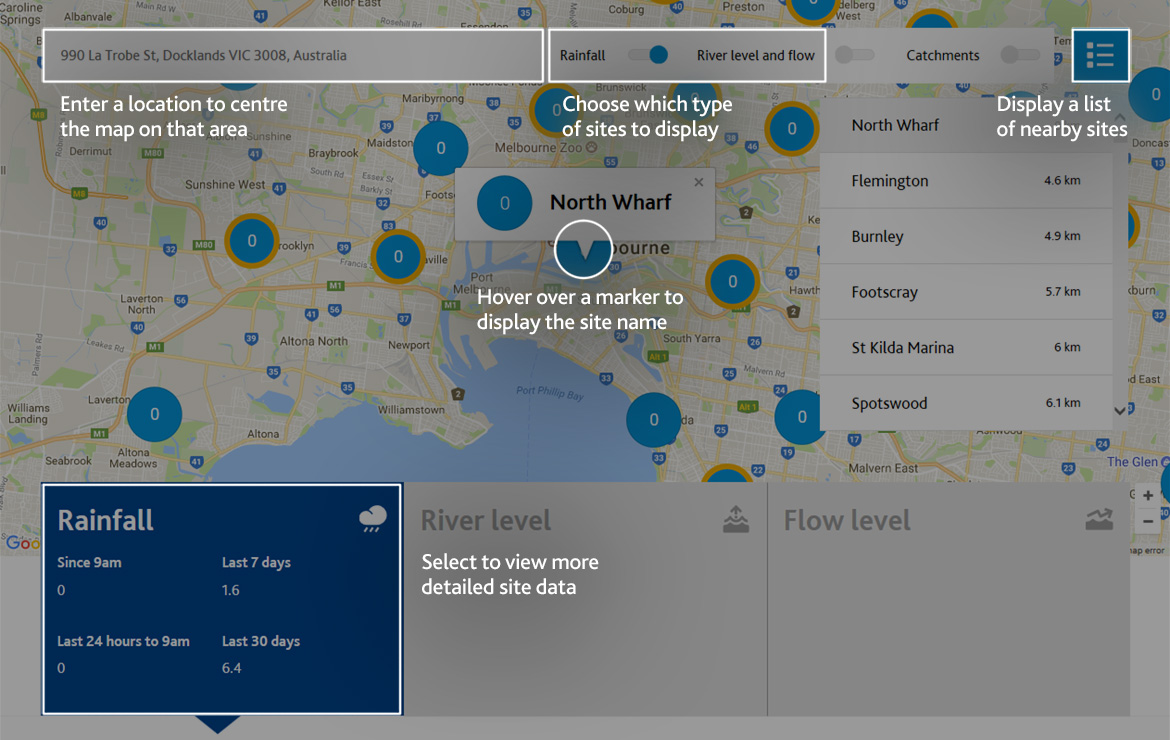
View and customise data
Select a site to display high-level data in the tabs below the map. Select a tab to see more detailed data and customise how this is displayed, including:
- frequency — such as hourly, daily or weekly
- date range
- graph (chart) or table views
Download data
All detailed data can be downloaded in a .CSV format for your own use, by selecting the ‘Download this data (.CSV)’ link below the table or graph.
Data collection and accuracy
While we have taken all due skill and attention in collecting, validating and providing our data, we shall not be liable for any loss of any kind caused by errors, inaccuracies, incompleteness or other defects in this information.
Hourly rainfall and river level data is automatically sent via radio signals from more than 200 electronic rain gauges, which record the amount of rain and time that it fell. This data has not been checked for accuracy.
Historical community rainfall data is submitted to us each year by more than 300 volunteers, who take daily readings from their own rain gauges. This data has not been checked for accuracy and varies by location — some volunteers have been active for decades while others are relatively new.
Request data
The app contains all the data collected since we began publishing it on our website in 2004, but we also have a large amount of historical hydrologic data:
You can request hydrologic data for a fee, which offsets our data collection, processing and storage costs.
How we use our data
Our data helps us understand rainfall patterns across Melbourne, especially after heavy storms. It also helps us plan responses to droughts and floods, and make sure rivers and creeks have enough water to support local wildlife.
Some of these activities include:
- flood warnings, storm frequency estimates and simulating potential floods
- environmental flow monitoring and reporting
- waterway diversions and streamflow management plans
- waterway health assessments and reports, including requirements for wetlands, fishways and stabilisation works
- analyses for water supply, sewerage and drainage system operations and capacity
- water resource planning, such as analysing and modelling catchment yield