Sugarloaf Reservoir supplies the northern, eastern and central suburbs of Melbourne. It can store water pumped from the Yarra River and Maroondah Reservoir, and up to 75 billion litres of water a year from the Goulburn River via the North-South Pipeline (when in operation).
The water from Sugarloaf Reservoir flows out to service reservoirs in northern and eastern suburbs, typically from Whittlesea to Eltham. When mixed with water from Silvan Reservoir, water from Sugarloaf is supplied even further out west to suburbs such as St Albans and Werribee.
Key facts
The dam at Sugarloaf Reservoir is a rolled rockfill embankment with upstream concrete face, and was completed in 1981.
Water from Sugarloaf is fully treated at the nearby Winneke Water Treatment Plant, which provides about a quarter of Melbourne’s drinking water.
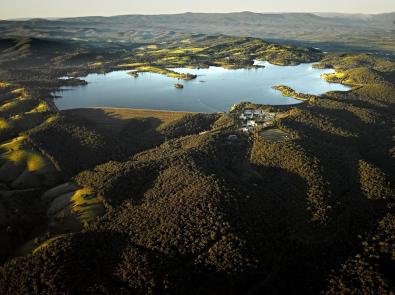
- Catchment area: 915 hectares (off-stream storage)
- Surface area: 440 hectares
- Total capacity: 96,253 megalitres
- Dam height: 89 metres
- Dam length: 1,050 metres (main bank only, saddle dams are are an extra 690 metres)
Water catchment protection and access
Sugarloaf Reservoir is an off-stream reservoir, receiving water from on-stream reservoirs and other sources. Limited public access is permitted for recreation, including:
- licenced sailing activities on the reservoir (Sugarloaf Sailing Club), but no kayaking or entering the water (for example, swimming)
- limited lure-based shoreline fishing in designated areas, without using live bait
- accessible public walking track, but no dogs permitted
- no camping or fires.
Melbourne Water continually reviews our protected catchments to determine if more areas can be opened to the public. While this would allow more people to enjoy Victoria’s vast natural spaces, it must be balanced with protecting our precious drinking water for the safety of our community.
Rainfall over the years
View highlights from our historical rainfall data for Sugarloaf Reservoir, including annual rainfall, monthly averages, and the wettest and driest years by month.
Live rainfall and water storage data
Get the latest information on each of our 10 major reservoirs, including daily water storage levels and hourly rainfall and river level data.
Annual rainfall at Sugarloaf (1982-2022)
")
Monthly rainfall records (mm)
Last updated: January 2023
| Month | Wettest | Driest | Average |
|---|---|---|---|
| January | 113.4 (1995) | 1.8 (2009) | 53.3 |
| February | 171.2 (2011) | 0.0 (1991) | 45.2 |
| March | 116.2 (1989) | 14.4 (2005) | 47.5 |
| April | 166.4 (2020) | 13.8 (2019) | 63.2 |
| May | 127.6 (1987) | 18.2 (2005) | 62.0 |
| June | 131.8 (1991) | 20.4 (2006) | 66.8 |
| July | 101.8 (1986) | 16.0 (2001) | 58.2 |
| August | 106.8 (1990) | 25.0 (2007) | 68.3 |
| September | 163.0 (1992) | 18.6 (2018) | 73.7 |
| October | 213.4 (2022) | 12.8 (2006) | 75.4 |
| November | 181.6 (2004) | 12.8 (1982) | 74.0 |
| December | 195.0 (1985) | 5.8 (2019) | 69.9 |
| Annual total | 1056.4 (2011) | 519.6 (1997) | 757.6 |
You may also like...
North–South Pipeline
The 70km pipeline can carry water from the Goulburn River to Melbourne in times of critical human need.

Water treatment
Learn how we treat Melbourne's water to make sure it is safe to drink.
Our water supply system
Melbourne has some of the highest-quality drinking water in the world. Learn how it makes its long journey to your tap.