Land development reference 5.3.2
The hydrologic and hydraulic design requirements for drainage systems are described below. This information supplements the policies, objectives, and design considerations of Development services schemes and their components, including aspects affecting aesthetics and soft engineering.
This section includes details on the design of drainage systems, focusing on hydrologic and hydraulic aspects.
Hydrology
Generally we'll be able to provide peak flow rates for the design of our main drains. Consultants are therefore required to seek this information from us prior to commencing the design of our main drains.
Where we're unable to provide peak flow rates the consultant will be required to calculate them using the methods described below.
Method 1 - The Rational Method
The Rational Method is generally used to calculate design peak flow rates throughout the pipeline drainage system, provided the drainage catchment is less than 400 hectares. The method doesn't allow for flood storage effects. Therefore, when there are or will be retarding basins in the system, suitable adjustments must be made for the basin outflows, or an alternative method providing for flood storage effects must be used.
The peak flow rate resulting from a storm with an average recurrence interval (ARI) of Y years is calculated using the following formula:
Q = CyIyA / 360 (m3/s)
where
Q = peak flow rate resulting from storm ARI of Y Years
Cy = runoff coefficient for design event having an ARI of Y Years (dimensionless)
A = area of catchment (hectares)
Iy = rainfall intensity (mm/hr) corresponding to a particular storm duration and ARI. The duration is set equal to a sub-catchment time of concentration.
The following guidelines are provided for use of the Rational Method, including values we require to be used:
- The downstream design peak flow rate shouldn't be less than the upstream flow rate for a piped system
- Partial area effects should be considered in the design
- The applicable average recurrence interval, runoff coefficient, area of catchment and design average rainfall intensity will be determined as shown below
Design average recurrence interval
The hydraulic design for the total drainage system (the underground pipeline plus the surface drainage system) must cater for 100 year ARI flood flows.
In a conventional drainage system, the underground pipeline component is usually designed for a five year ARI but in some cases this may vary (e.g. if an alternative standard is required by the local municipal council). If there's any doubt on whether a greater or lesser standard should be adopted for this component of the drainage system we must be consulted.
Runoff coefficient
Runoff coefficients provide for the relationship between runoff and rainfall volumes and make provision for intermixing of pervious and impervious surfaces.
Table 1 below presents a range of coefficients to be applied to various land use.
| Land use | C (5 Year ARI) | C (100 Year ARI) |
|---|---|---|
| Major open space | 0.20 | 0.30 |
| Residential (avg lot size): | ||
| 4000 m2 | 0.30 | 0.40 |
| 750 m2 | 0.40 | 0.50 |
| 500 m2 | 0.50 | 0.65 |
| 350 m2 | 0.60 | 0.75 |
| < 350 m2 | 0.70 to 0.90 | 0.9 |
| Major road reserves | 0.50 to 0.80 | 0.65 to 0.9 |
| Commercial/industrial | 0.70 to 0.90 | 0.9 |
Table 1 - Runoff coefficients
If different ARIs are required, and for situations in which there are a range in values in the table, or where the proposed land use is different to that prescribed, the fraction impervious must be estimated and taken into consideration.
Area of catchment
This is the total sub-catchment area draining to a particular pit or pipe.
Time of Concentration (Tc)
The time of concentration at a particular location is generally the time required for runoff to travel by the longest available flowpath to that location.
In many cases however a "partial area" affect occurs through the lower part of the catchment, where flows are higher than those calculated for the entire catchment, because the time of concentration is lower and the design rainfall intensity is higher.
Calculating the Time of Concentration
Pipe systems
The time required for runoff to enter a pipe system (initial time) is assumed to be seven minutes for a residential allotment and five minutes for a side entry pit. To this must be added the travel time through each section of pipe, which is determined by its length and the average velocity.
The pipe travel time is calculated by determining the size, length and velocity for each section of pipe. The initial time is added to the pipe travel time to determine the overall time of concentration. A rainfall intensity corresponding to the time of concentration is obtained from an IFD relationship and used to calculate the design flow for each subcatchment and therefore the flow through each section of the pipe. The velocity can then be determined and compared against the initial estimate. If necessary the process is repeated.
Consideration may also need to be given to partial area effects (described in Time of Concentration), where a shorter branch of a drainage system may produce a larger flow than the longest travel path.
Water Sensitive Urban Design (WSUD) incorporated into a development may affect times of concentration, and therefore the applicable design rainfall intensity for small storm events (e.g. three month ARI events). This in turn will affect pipe flows. However flows during significant storm events (greater than one year ARI flow) will usually bypass treatment measures, resulting in no impact on times of concentrations used to design the underground pipe system.
Example:
Five year ARI
The time of concentration is required for a catchment which has the following drains on the longest flowpath:
- 300, Length = 240m, pipe velocity = 2 m/s
- 450, Length = 300m, pipe velocity = 2.5 m/s
- 750, Length = 420m, pipe velocity = 2 m/s
- tc = initial time + pipe travel time
- initial time = seven minutes for a residential allotment
- pipe travel time = (240/2) + (300/2.5) + (420/2) = 450 seconds = 7.5 minutes
- tc = 14.5 minutes
Total drainage system
Flow calculations for the total drainage system must take into account the different flowpaths taken by the minor and major systems, any overflows from other drainage systems, and the interaction between minor and major system flows.
For calculating the time of concentration for the overland system (the major flow) the slope of the land and the roughness coefficient of the surface will vary the flow times.
Rainfall intensity
Rainfall intensities corresponding to the design storm ARI at the locality must be calculated or read from Intensity Frequency Duration (IFD) charts or tables.
The Bureau of Meteorology can produce IFD charts using up to date information. Some municipalities use these charts for drainage design and their use is permitted for our main drains provided a copy of the IFD chart is included with the design computations.
Method 2 - Hydrological computer models
For catchments larger than 400ha or where there are significant flood storage effects, runoff routing using a suitable hydrologic model (such as RORB or RAFTS) should be used. Advice regarding methodologies and parameters for use with computer models should be sought from us.
Hydraulics
Hydraulic calculations are required to design our drains and channels. This section deals with the methods required to be used for hydraulic design.
A Hydraulic Grade Line (HGL) analysis is required for all designs to ensure water flows through underground pipes and overland flow systems in the manner intended. The finished surface level of developed land is a primary consideration when determining hydraulic grade requirements.
General freeboard requirements
Freeboard is the height above a defined flood level, typically used to provide a factor of safety in, for example, the setting of floor levels and levee crest levels (i.e. design flood event). Freeboard compensates for effects such as wave action, localised hydraulic behaviour settlement of levees and sedimentation in waterways, which increase flood levels or reduce the level of protection provided by levees. Freeboard also provides protection from floods that are marginally above the defined flood level. However, freeboard should not be relied upon to provide protection for flood events larger than the defined flood event.
Source: Floodplain Management In Australia, Best Practice Principles and Guidelines, SCARM Report 73, CSIRO Publishing, 200).
Freeboard is required to set minimum fill and/or floor levels in new developments that are in the vicinity of overland flowpaths, open waterways (river, creek, channel) and floodplains.
For greenfield subdivisions and large scale urban redevelopments our requirement is for new buildings and urban lots to be located outside active flow areas, and to be filled to meet the following minimum freeboard requirements:
-
0.3 metres for land adjacent to overland flowpaths
-
0.6 metres for land adjacent to waterways or within their floodplains.
Filling of land isn't always appropriate and we may set requirements (such as balanced cut and fill) to ensure flood storage isn't affected or alternatives to land fill may be set. If the latter applies then the floors of new structures will be required to have the same minimum freeboards as those specified above.
Higher freeboards may be required where additional margins of safety are warranted, e.g. accesses and buildings occupied by State Emergency Services, hospitals or retirement villages.
Where development is contemplated in areas having a poor surface gradient it may be difficult to provide effective drainage. For small developments, it's good design practise to build floor levels at least 450 mm above natural surface level. However for greenfield subdivisions suitably designed drainage will be required.
More detailed information can be found in Guidelines for development in flood prone areas.
Pipe drains
A full HGL analysis is required for all designs. The pipe drain must be able to convey the design flow without the HGL reaching above the top of the pipe, except where there are special circumstances requiring the use of a pressurised pipe, such as a culvert through an embankment. The overall aim of pipe drain design is to achieve this efficiently by minimising losses.
Calculation of the HGL for a pipe drain involves estimation of all of the head losses associated with the flow. These head losses can be grouped together as follows:
Total Head Loss = friction losses
- + Pit losses
- + Bend losses
- + Transition losses
Some design constraints also apply:
-
The minimim size of pipe (other than property inlets) shall be 300 millimetres
-
To enable the pipe to be capable of self cleaning during dry weather flows, the velocities shall be at least 1.0 m/s for the pipe running full and at least 0.8 m/s for the pipe running 1/3 full
-
The maximum full flow velocity shall be no more than 6.0 m/s to minimise wear on the pipe invert
-
For drains on flat grades, where self cleaning velocities may be difficult to achieve, additional pits shall be provided to facilitate desilting and removal of debris
-
The minimum clear cover shall be 750 millimetres in general (600 millimetres for short lengths) or in accordance with manufacturers specification as agreed by us
-
The minimum vertical and horizontal clearances between a stormwater pipe and any other pipe or service conduit shall be 150 millimetres, subject to the approval of the relevant service authority
-
In areas of high water table and sandy soils, or where the pipe is designed to run under pressure, rubber ring joint pipes shall be used
-
Reinforced concrete pipes are the preferred type when their location is sufficiently far enough from power lines. Alternate construction material, such as HDPE pipes shall be subject to the approval of us
Minimising losses
One of the main aims of pipe design is to minimise the head losses associated with pits, bends and transitions. This will help keep the diameter of the pipeline (and therefore its cost) to the minimum necessary to achieve the design flow capacity, and will also reduce the incidence of overflows from the pipe system.
Minimisation of pit losses can be achieved by:
-
aligning pipe obverts through the pit
-
avoiding changes of direction in pits
-
shaping pits to match the pipe cross section
-
angling pipe connections downstream.
Minimisation of bend losses can be achieved by:
-
using a series of bandage joints to change direction, rather than at a single pit or mitre joint
-
using splay pipes instead of a series of mitre joints or bandage joints
-
increasing the radius of a splay (the radius is greater than 8 times the pipe diameter losses are negligible)
Minimisation of transition losses can be achieved by:
-
avoiding sudden changes in velocity
-
providing transition structures to reduce the rate of change of velocity.
Estimation of friction losses
Friction losses in pipe drains are calculated using the Colebrook-White formula or the Manning's formula. Generally, subject to the previously specified design constraints, the pipe diameter that can keep the HGL to acceptable limits is the one selected.
Colebrook-White formula
A simplified form of the Colebrook-White formula applicable to pipes is:
V = (32gRS)0.5 log10(14.8R/k)
where
V = the mean velocity of flow (m/s)
g = acceleration due to gravity (9.8 m/s2)
k = pipe wall roughness (m) (0.0015 m for concrete pipes)
R = hydraulic radius (m) = D/4 for pipes flowing full
D = actual internal diameter of the pipe (m)
S = hydraulic grade
The discharge (Q) from the drain is calculated:
Q = V x A
where
Q = discharge (m3/s)
A = cross-sectional area of the drain (m2)
V = velocity in direction of flow (m/s)
Use of the Colebrook-White formula is further simplified using graphical means. This discharge diagram is for circular pipes flowing full. The diagram applies to Class 2 Circular concrete pipes, which are the pipes generally used in drainage design. For larger load classes (e.g. Class 3) a diagram applicable to the higher load, or the formula, must be used.
Manning's formula
Manning's formula is:
V = 1/n x R2/3 x S1/2
where
V = the mean velocity of flow (m/s)
g = acceleration due to gravity (9.8 m/s2)
R = the hydraulic radius (m)
= D/4 for pipes flowing full
D = the actual internal diameter of the pipe (m)
S = the hydraulic grade
n = roughness coefficient = 0.013 for concrete pipes
Estimation of pit losses
Pit losses are usually expressed as a function of velocity head:
hL = k (Vo2/2g)
where
hL = head loss (m)
k = head loss coefficient
Vo = outlet pipe full velocity (m/s) = Q/A
g = 9.8 m/s2
Determine the values of k using either:
-
Loss Coefficient for Pits and Junctions
-
Pressure Changes at Storm Drain Junctions, Engineering Bulletin No.41, University of Missouri (Sangster, Wood, Smerdon and Bossy, 1958)
The values of k in these references have been determined with pits that had no shaping in the base of the pit. The values of k should be applied to the velocity head in the outlet pipe i.e. Vo2/2g.
Our standard junction pits (see our Drawings 7251/8/315 and 7215/8/316 for an example) have shaped bases which improve hydraulic efficiency and lower pit losses. This is illustrated in Figure 1 below.
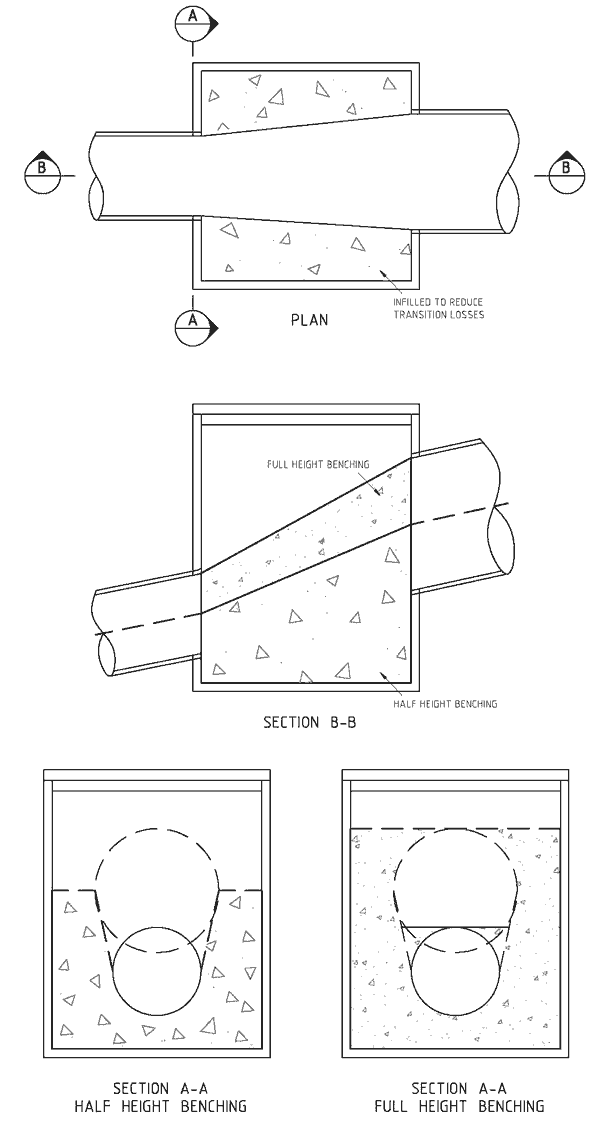
Figure 1 - Benching
Pit losses can be reduced by incorporation benching in the floors of junction pits. Half height benching is a more common approach in minimising pit losses, however full height benching may be required if the need to minimise losses is critical in the design of the system.
As indicated in Table 2 below, pit loss coefficients determined using Loss Coefficient for Pits and Junctions can be reduced by up to 40% by shaping the base of the pit. The results are based on research from Johnson et al 1989, Dick and Marasalek 1985 and Lindvall 1984 and apply to square pits.
| Pit type | Potential decrease in loss coefficient (%) half height benching | Potential decrease in loss coefficient (%) full height benching |
|---|---|---|
| Straight through | 30 | 40 |
| 90° bend | 20 | 40 |
| Tee pit with lateral inflow less than 50% | Nil | Nil |
| Tee pit with lateral inflow approximately 50% | Nil | 10 |
| Tee pit with lateral inflow approaching 100% | 20 | 40 |
Table 2 - Pit loss coefficients
Note: Table 2 is based on testing of square pits.
Source: Queensland Urban Drainage Manual, Edition 1-1, April 1993.
Estimation of bend losses
The hydraulic losses for curves and angles are calculated using the Curve Losses in Circular Conduits diagram in Curve Losses in Circular Conduits.
Assume the minimum centre-line radius for the curve is 8D. Normally the curve losses are added to the grade loss for the pipe and the physical grade is steepened to include the curve losses. For example, a 100 metre pipeline with two curves has an initial physical grade of one in 100. Over the length it has a grade loss of one metre and total curve losses for the two curves of 0.06m. These two losses are added for the length and equal 1.06m. The new physical grade of the 100 metre pipeline will be one in 94 in order to provide the same capacity.
In practice, splay pipes are not normally used unless the diameter is larger than 750 millimetre.
Estimation of transition losses
A transition is a location where a conduit (pipe) changes size. Typically transitions should be avoided and changes in pipe size made to occur in pits or manholes.
The amount of energy lost at transitions between pipes with different diameters should be minimised by adopting gradual transition with a longitudinal change of no more than one in four (see Figure 2) . In most circumstances no loss is assumed for transitions constructed in this manner. However there will be instances where loss assessment at the transition becomes critical and the losses must be calculated.
Expansions
This is when there's an increase in the waterway area as shown in Figure 4. To calculate the energy lost at an expansion transition:
Loss (m) = k (V12 - V22)/2g
where
k = expansion coefficient
V1 = velocity upstream of the transition (m/s)
V2 = velocity downstream of the transition (m/s)
The value of k will vary according to the design parameters. For non-pressure flow situations k will typically vary from about 0.3 for gradual transitions of 15 degrees to 1.0 for abrupt square edged expansions.
Values of k for transitions (and contractions) can be found in:
-
"Hydraulic Engineering Circular No. 22 - Urban Drainage Design Manual", Federal Highway Administration, August 2001:
-
"Internal Flow Systems" (Miller, 1978)
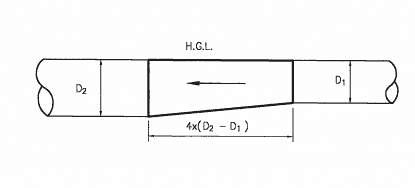
Figure 2 - Expansion Transition
Contractions
This is when there is a decrease in the waterway area. To calculate the energy lost at a contraction transition:
Loss (m) = k (V12 - V22)/2g
where
k = contraction coefficient
V1 = velocity upstream of the transition (m/s)
V2 = velocity downstream of the transition (m/s)
For gradual contractions k values typically equal half the values of the expansion coefficients.
Hydraulic Grade Line (HGL)
The HGL should be determined by commencing at the downstream end of the drain to be designed. We may be able to provide advice regarding the level of the downstream HGL. Where we're unable to provide the level of the downstream HGL (and backwater effects are not expected) then the obvert of the downstream pipe should be used as the level of the HGL.
The pipe drain should be designed to ensure that the HGL is generally no more than 300mm above the obvert of the drainage pipe or culvert and preferably closer to the level of the obvert. The HGL must also be at least 300mm below the finished surface level.
Example HGL calculation
The diagram below shows an example of good design practice in terms of minimising head losses, pipe sizes and costs. Pits are located at nodes 1, 2 and 3. The pipe is splayed between nodes 2A and 2B.
For this exercise the five year-ARI peak flows have been determined, and the level of the existing downstream pipe has been measured (to Australian Height Datum). The hydraulic design of the pipe is required.
The head losses are calculated for each reach and each pit. The head losses are added to the HGL on the longitudinal section starting at the downstream end (refer Figure 3).
The pipe is then positioned below the HGL.
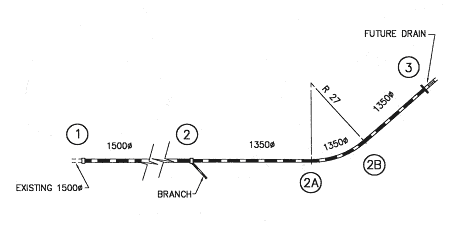
Figure 3 - Plan showing pipe characteristics
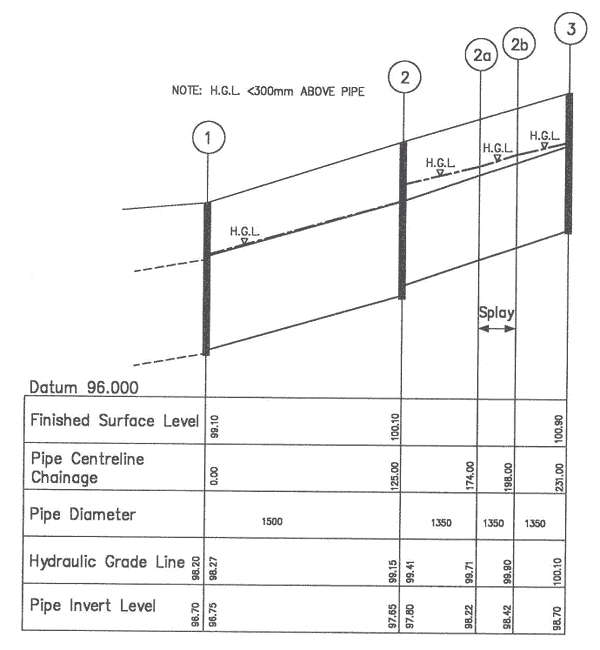
Figure 4 - Longitudinal section of the pipeline shown in Figure 5
Hydraulic Calculations
| Reach | Existing 0-1 |
1-2 | 2-2A | 2A-2B | 2B-3 |
|---|---|---|---|---|---|
| Q (m3/s) | 6.3 | 6.0 | 4.2 | 4.2 | 4.2 |
| D (mm) | 1500 | 1500 | 1350 | 1350 | 1350 |
| V (m/s) | 3.5 | 3.3 | 2.9 | 2.9 | 2.9 |
| L (m) | n/a | 125 | 49 | 24 | 33 |
| Sf (1 in…) | n/a | 142 | 165 | 165 | 165 |
| Hf (m) | n/a | 0.88 | 0.30 | 0.15 | 0.20 |
| Hb (m) | n/a | 0 | 0 | 0.04* | 0 |
Table 3 - Pipe Losses
*Note: the use of splay pipes to minimise the bend losses.
Q = peak flow rate (5 year ARI) (m3/s)
D = pipe diameter (mm)
V = pipe full velocity (m/s)
L = length of pipe (m)
Sf = slope of the Hydraulic Grade Line (1 in)
Hf = head loss due to pipe friction (m)
Hb = head loss at bend (m)
HT = head loss at transition (m)
| Pit | 1 | 2 | 3 |
|---|---|---|---|
| Vo (m/s) | 3.5 | 3.3 | 2.9 |
| kp | 0.12*2 | 0.6*2 | 0*3 |
| Hp (m) | 0.07 | 0.26 | 0 |
Table 4 - Pit Losses
Notes:
*1: From Appendix C the pit loss coefficient is 0.2. Reduce by 40% by shaping base of pit (Table 4).
*2: Qu/Q0 = 0.7. From Appendix C for Qu /Q0 = 0.9 kpit = 0.5. For Qu /Q0 = 0.5 kpit = 1.5.
Where Qu = peak flow upstream (m3/s), Q0 = peak flow downstream (m3/s)
By interpolation kpit = 1.0. Reduce by 40% by shaping base of pit.
*3: There will be no pit losses for pit 3 until the upstream drain is constructed.
Structures
Various physical structures may be used in the drainage system. These affect the hydraulic design and include:
-
drop structures
-
duckunders
-
surface inlet and outflow pits
Drop structures
A drop structure is a physical structure designed to lower water levels rapidly and should be used whenever the proposed drain is to drop more than 600mm.
Situations in which drop structures should be considered include:
-
where there's a rapid drop in elevation
-
where it's necessary to reduce the flow velocity of an outlet to an open waterway (in which case a change in direction should also be used)
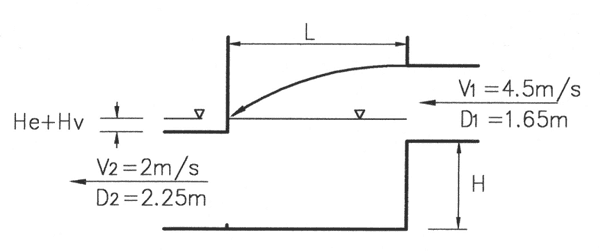
Figure 5 - a drop structure
The length (L) of the drop structure should be calculated to prevent the flows from striking the opposite wall of the structure. Using Figure 5 as an example, and assuming H=2m.
At outlet
He + Hv = 0.5V22/2g + V22/2g = 0.31 m
S = H + D1 - (0.31 + 2.25) = 1.09m
S = ut = 0.5(gt2) ==> 1.09 = 0.5(9.8*r2) ==> t = 0.47 seconds
L = V1 * t = 4.5 * 0.47 = 2.1 metres
where
He = entry head loss (m)
Hv = velocity head (m)
g = acceleration due to gravity (9.8 m/s2)
L = length of drop structure (m)
S = top of ponded level in drop structure (m)
u = initial vertical velocity (= 0)
If the length of the drop structure required to prevent the flows from striking the opposite wall of the structure is excessive, it can be reduced, provided the downstream face of the drop structure is designed to accommodate impact forces.
Sacrificial concrete to a depth of 25mm should also be used on the base of the structure to allow for pit scour caused by low flows.
Duckunders
A duckunder is a special transition that allows drains to pass beneath underground obstructions which can't be altered. It's different to a syphon as the pipe invert isn't altered.
The use of syphon isn't considered to be desirable design practice and is to be avoided. Likewise the use of a duckunder is to be avoided if at all possible.
When a duckunder is to be included in a design, we must be provided with a written submission which includes evidence of alternatives considered and copies of correspondence with the owner of the obstruction(s).
A duckunder is normally designed with a constant cross-sectional area to maintain constant velocity. Head losses will be minimal in this case provided the rate of change of the cross section shape is gradual. Longitudinal rates of change of one in four are considered appropriate.
There may be some circumstances in which a constant cross-sectional area can't be achieved because of site constraints. If there's any reduction in the area through the duckunder which results in a rise in velocity, then transition losses must be calculated.
Figure 6 and Figure 7 show examples of a duckunder with a reduced cross sectional area.
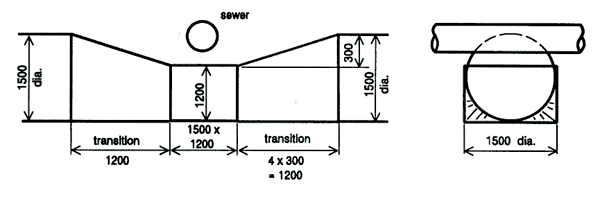
Figure 6 - Circular to Rectangular Duckunder
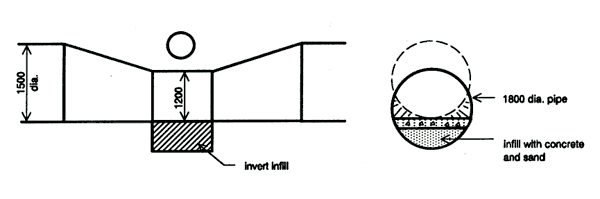
Figure 7 - Duckunder using invert infill in a pipe
Surface inlet and outflow pits
Surface inlet pits, spaced at regular intervals, are used to capture surface flows so they can be conveyed through pipe drains. They may also be required to convey flows where surface water accumulates.
An example of the latter is shown in Figure 8 where a drain intersects a road. The piped drain beneath the road needs to pass both flows from the upstream pipe as well as flows passing along the road kerb to avoid the road pavement from flooding.
If a separate floodway culvert can't be installed under the road, a larger drain can be used between the pits at A and B to pass the extra flow.
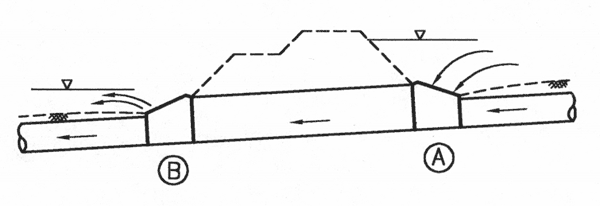
Figure 8 - Inlet pit at A and overflow pit at B
The HGL will rise to the surface level at B and the flow will discharge to the surface once the capacity of the drain downstream of B is exceeded, provided the flow is directed to the floodway and the outflow pit has sufficient capacity. The downstream wall of the outflow pit must be low to direct water out of the pit in a downstream direction.
Great care needs to be taken in the design of the outflow pit as the head loss can be greater than the total available head if the design isn't undertaken correctly.
Consideration will need to be given to the transitions (refer Estimation of Transition Losses) at the two pits during the design of inlet and outlet pits to minimise energy losses in the system.
To calculate the head required to overcome the total energy losses:
Head = He + HpA+Hf + HpB+Ho (m)
where
He = entry head loss (m)
HpA = pit loss at pit A (m)
Hf = friction head loss (m)
HpB = pit loss at pit B (m)
Ho = outlet head loss (m)
Inlet and outlet grates
Grates are required over the pits for safety reasons. During the design, allow for 50% blockage of the upstream grate and 25% blockage of the downstream grate. It may be more economical to construct both grates with equal sized openings.
To size a grated opening the following equation can be used for flow entering a horizontal grate (Ref. Open Channel Hydraulics - Chow, e.q. 12.23).
Q = eCLB (2gE)0.5
where
Q = Required flow through grate (m3/s)
e = Portion of area not taken up by bars (Total Area - Area of Bars)/Total Area
C = Discharge co-efficient (=0.45)
L = Grate Length (m)
B = Grate width (m)
g = 9.8 m/s2
E = Specific Energy = Depth above grate + V2/2g (but V=0) (m)
Channels
The majority of drainage channels within the our drainage system fall into one or several of the following categories:
-
natural channel
-
rock lined channel
-
concrete channel
-
grassed channel
Calculating channel capacity
The hydraulic design of channels may be based on Manning's equation:
where
Q = channel discharge (m3/s)
A = flow area (m2)
R = hydraulic radius area/wetted perimeter (m)
S = slope of hydraulic grade line
n = Manning's roughness coefficient
Manning's n is a roughness coefficient which should be assessed/derived from careful and conservative (i.e. use a higher value when unsure) consideration of the surface that the water flow is in contact with (e.g. concrete pipe, grassed channel - well maintained etc). A general guide is:
-
road Reserves (flow in road and verges) n = 0.025
-
grassed reserves/floodways (regularly mowed) n = 0.035
-
concrete pipes n = 0.013
-
concrete channels n = 0.015
-
rural floodplains in cleared paddocks n = 0.05
-
overland flow -
-
existing residential development where blockages have been accounted for separately: n = 0.05
-
otherwise: n = 0.08 or higher
-
-
individual creeks, waterways: Refer to Open Channel Hydraulics by Ven Te Chow
The values of Mannings n for other materials can be obtained from Open Channel Hydraulics (Chow 1959). Alternatively we can be contacted for advice for the appropriate Mannings value (n) to be used in specific situations.
The limiting velocity for concrete lined channels is 6m/s to prevent damage to the concrete surface. Safety and hydraulic design issues normally require a lower velocity. The hydraulic design of the channel should ensure the flow is subcritical (although exceptions may occur at specially designed energy dissipation structures).
The limiting velocity for grass lined channels will vary depending on a number of parameters including the quality of vegetative cover and the flow duration. Established grass lined channels should have a limiting velocity of 2 m/s where there's a low flow pipe or stabilised low flow channel. Rock lining or other channel stabilisation may be required for velocities greater than 1.5 m/s.
Channel flow calculations can be undertaken "manually" as detailed below or by using a hydraulic computer model such as HEC-RAS or MIKE 11. HEC-RAS is the Windows version of HEC-2 and is the industry standard for undertaking steady state channel flow hydraulic calculations.
Channels with varying n
Where channels are to be constructed of a composite of various materials such as rock, grass and concrete, the compound channel method or the composite manning's method must be used.
Compound channel method
This method is only appropriate for short lengths of channel with uniform cross-section.
Figure 9 displays the cross-section of flow in a channel. Use this method to calculate the flow separately in each of the three areas (1, 2 & 3), then add these together for the total flow. The shear at the interfaces between the areas should be taken as zero. The wetted perimeters for areas 1, 2 and 3 will then be ab, bc and cd respectively.
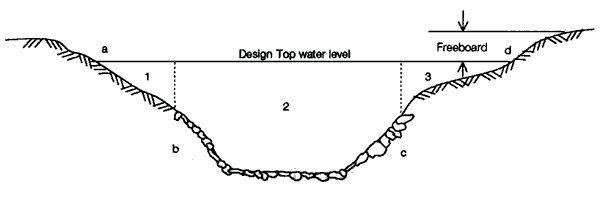
Figure 9 - Typical channel cross-section
The total capacity (QT) is determined by:
QT = Q1 + Q2 + Q3 (m3/s)
where Q1 = Q2 = Q3 = (A1R12/3S11/2) / n1
Note: Designers should consider using computer modelling alternatives to compound channel method. Computer programs such as HEC-RAS are quicker and more accurate.
Should designers not have access to computer modelling systems they may contact an appropriately experienced consultant (or us) for assistance.
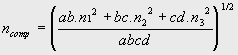
Composite n method
Use the composite n method for the entire channel section as displayed in Figure 9 using:
Q = (AR2/3S1/2 (m3/s)) / ncomp
where
Erosion protection works
Where streams are subject to erosion or may experience erosion due to changes in the drainage system (e.g. construction of drain outlets, increases in rates or velocities of runoff, channel deepening or straightening) then erosion protection works may be required.
The aim is generally to retain a stream system in a form as close as possible to a natural stream (given the constraints of existing conditions, available land and flow regime).
For guidance regarding the design of erosion protection works please contact us or make reference to Earth Tech, 2006. Technical Guidelines for Waterway Management- Draft. Unpublished report to Dept of Sustainability and Environment, Victoria.
Bridges
The design of a bridge is largely dependent on the characteristics of the waterway. A bridge is preferable to culverts for the crossing of the waterway.
Bridge design objectives
The design objectives for bridges are:
-
to pass the design flow under the bridge
-
preferable clear span bridge with no piers or abutments within the riparian corridor or floodplain
-
to ensure no afflux due to construction of bridge
-
to protect the waterway from scour and erosion
Bridge design considerations
A clearance of 600 millimetres between the one in 100 year peak flood level and the underside of the bridge is required for road crossings.
Where clearance of the one in 100 year flood event can't be achieved, subject to approval by us, the top surface of the bridge must be above the one in 10 year flood event and overtopping of flows across the pavement must meet our Safety Criteria where the Velocity x Depth product must not exceed 0.35m2/s.
Abutments should be set back so our maintenance access and the structural loading upon the waterway embankment aren't adversely impacted.
Construction works must minimise disturbance to the bed, banks and riparian vegetation of the waterway. Any damage to the waterway must be rectified and the original condition reinstated and revegetated. A method of construction must be submitted to us.
Culverts
The term "culvert" can be applied to any large underground pipe, however, in the context of this section it applies to a relatively short length of pipe to convey flood water under an embankment. Culverts are often used under road embankments, railway embankments and as outlets in retarding basins.
Culvert design objectives
The design objectives for culverts are:
-
to pass the design flow under the embankment (or to limit the flow overtopping the embankment)
-
to limit the flood level upstream of the culvert
-
to protect the downstream waterway from scour
-
to consider the hydraulic impacts of culvert blockage
-
to facilitate fish passage
Typically, culverts on our drains or waterways are designed to pass the 100 year ARI peak flow without overtopping the embankment. For example, culverts with 100 year ARI peak flow capacity are generally provided for freeway culverts and for retarding basin outlets.
In some situations this isn't likely to be cost effective and some flow will be permitted over the embankment in a 100 year ARI flood event. The design standard for the culvert may be set by another organisation (e.g. VicRoads or the local council), however, generally we require any overtopping complies with the safety requirements in Floodway safety criteria.
Culvert hydraulics
The hydraulic operation of culverts is complex and often difficult to predict. The first aspect of the hydraulic design is to determine the hydraulic point of control for the culvert, either inlet or outlet control.
To decide if a culvert's capacity is inlet or outlet controlled requires both types of flow regimes to be analysed. The result which gives the lower culvert capacity (or the higher upstream water level) is the type of flow which controls the operation of the culvert.
Culverts flowing full for their entire length are always under outlet control. Culverts flowing part full at their outlet may operate under inlet or outlet control.
Refer to Hydraulics of Precast and Concrete Conduits by the Concrete Pipe Association of Australia for design charts.
Outlet control
The analysis of outlet control flow requires the consideration of all head losses between the inlet and outlet of the culvert. These head losses are added to the tailwater level to determine the upstream flood level.
Head losses = Entry loss + Friction loss + Exit loss
where
Entry loss = ke*V2/2g
Friction loss = (determined from pipe flow equations or charts)
Exit loss = kex*V2/2g
Typical entry loss coefficients are given in Table 5 & Table 6.
Exit loss co-efficients (kex) generally vary between 0.3 and 1.0. In a standard culvert where flow expansion is sudden, the exit loss coefficient is typically set to 1.0. For further information refer to the Federal Highway Administration (FHWA 1985).
| Type of Structure and Entrance Design | Entry Loss Coefficient ke |
|---|---|
| Projecting from fill, socket end | 0.2 |
| Projecting from fill, square cut end | 0.5 |
| Headwall or headwall and wingwalls | |
| Socket end of pipe or rounded | 0.2 |
| Square edge | 0.5 |
| Mitred to conform to fill slope | 0.7 |
| Bevelled edges, 33.7o or 45o bevels | 0.2 |
| Side or slope tapered inlet | 0.2 |
| Metal pipe projection from fill, no headwall | 0.9 |
Table 5 - Pipe Culverts
| Type of Structure and Entrance Design | Entry Loss Coefficient ke |
|---|---|
| Headwall parallel to embankment, no wingwalls, square on 3 edges | 0.5 |
| Round 3 edges to radius 1/12 culvert height or bevelled on 3 sides | 0.2 |
| Wingwalls at 30 o to 75 o to culvert. Square edge at crown | 0.4 |
| Wingwalls at 30 o to 75 o to culvert. Crown edge rounded to 1/12 of culvert height | 0.2 |
| Wingwalls at 10o to 30 o to culvert. Square edge at crown | 0.5 |
| Wingwalls parallel (extension of culvert sides). Square edge at crown | 0.7 |
| Side or slope tapered inlet | 0.2 |
Table 6 - Box Culverts
Inlet control
Inlet control can occur for two types of flow:
-
Part full flow for the entire length of the culvert, including the entrance
-
Part full flow for part of the length of the culvert
Inlet control means the inlet is effectively acting as an orifice and therefore the orifice flow equation applies. A number of publications provide nomographs for determining culvert capacity under inlet control, including Hydraulics of Precast and Concrete Conduits, Concrete Pipe Association of Australia.
Prevention of scour at the outlet
The outlet velocity from an outlet structure may need to be checked for a range of flows to ensure that there won't be scour of the downstream waterway. If the outlet velocity is greater than 1.5 m/s, scour protection works will be required.
Where culverts are operating under inlet control, the outflow is usually supercritical and therefore velocities may be high and a hydraulic jump may occur downstream of the culvert. The outlet structure therefore needs to be designed to ensure the jet of water from the outlet doesn't extend beyond the concrete apron of the outlet structure and scour protection works are provided in the zone where the hydraulic jump could be expected.
Retarding basins
Design of a drainage system for 100 year ARI floods may include provision of retarding basins. Some retarding basins may include permanent or temporary water bodies and other facilities to provide for storm water treatment.
The following key criteria should be addressed as part of the initial data collection and design.
General requirements
The reason for the basin needs to be clearly determined and outflows set accordingly. Basins may be required for flood mitigation where there are existing flooding problems to control flows so existing infrastructure capacity is not exceeded as development proceeds, or to protect natural water courses.
General signage should be erected warning the area is subject to flooding.
Dual purpose use for recreation is encouraged provided it can be done safely where safe egress points can be provided.
Planting on the embankment should be limited to plants (eg shrubs) that don't have deep root systems that effect the structural stability of the earth embankment
Land use
Land use considerations include:
-
retarding basins should be built on public land or where the land is part of a subdivision, it should be transferred to a public authority (eg us/Council)
-
existing zonings and overlays should be checked and planning permits obtained where necessary. Re-zoning of the proposed site may be required to ensure the retarding basin is protected in the event of future development of the area
-
consideration should be given to the previous use of the area/site (eg old tip sites should have a clay liner)
Site constraints
To identify site constraints the following tasks must be undertaken:
-
topographical and geotechnical survey must be conducted of the proposed site prior to design and construction of the retarding basin
-
all services should be proved as part of the retarding basin design (prior to construction)
Design standards
We've developed guidelines to formalise our requirements for the general design, construction, operation and maintenance of retarding basins. Where designers believe a departure from the normal requirements set out in this guideline is warranted, we'll assess each proposal on its own merits.
You may also like...
Australia's official weather forecasts and weather radar.